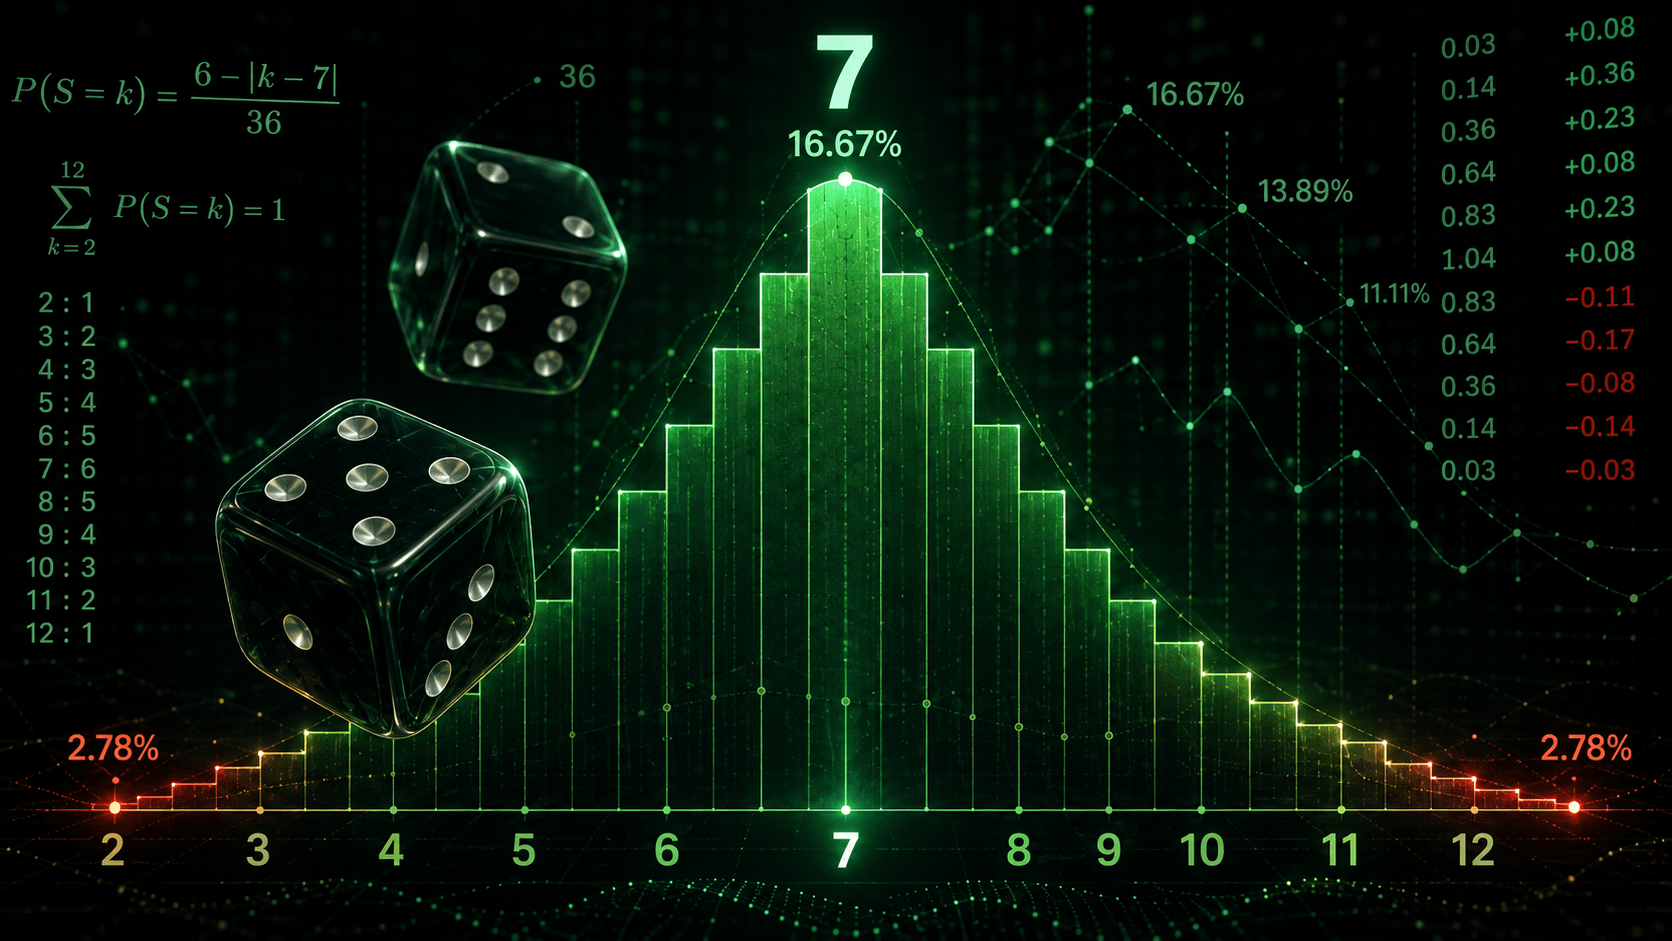
A single six-sided die gives each face a 1 in 6 chance, or 16.67%. Two dice produce 36 combinations, and the sums built from them are not equally likely: 7 arrives six ways out of 36 (16.67%), while 2 and 12 arrive one way each (2.78%).
That difference between outcomes and sums is where most dice errors begin, and it's the foundation every casino dice game is priced on.
Everything is charted below: all outcomes for one die, all 36 for two, the complete 216 for three, distribution summaries out to six dice, and odds tables for d4 through d20. The closing sections convert those probabilities into money, at a physical table and in the online dice games that carry the name.
The one rule behind every dice probability
Probability for a fair die is a counting exercise. Divide the number of outcomes you want by the number of outcomes that exist:
P = favourable outcomes ÷ total outcomes
The total is easy to find. One die has 6 faces, so two dice have 6 × 6 = 36 possible results, three dice have 6³ = 216, and six dice have 46,656. Each die is independent, meaning the first result has no influence on the second. Nothing carries over between rolls.
The counting of favourable outcomes is where people slip. A pair of dice has 36 outcomes but only 11 possible sums, so the sums have to share those 36 outcomes unevenly. Six of them add to 7. Only one adds to 12. Treating "sum of 7" and "sum of 12" as comparable is the single most expensive misunderstanding in dice games.
The formula, step by step
Take the probability of rolling 9 with two dice.
First, count the ways it happens: 3+6, 4+5, 5+4, and 6+3. A 3 on the first die with a 6 on the second is a different outcome from a 6 then a 3, so both count. That gives 4 favourable outcomes.
Then divide by the 36 total: 4/36 = 1/9 = 11.11%.
That's the whole method. Every table on this page is built from it.
One die: every outcome
A fair d6 has no favourite. Each face carries the same 16.67%, and the useful part of a single-die chart is the cumulative columns, which answer the question games actually ask: what are the chances of hitting a threshold?
| Face | Probability | Percent | That number or lower | That number or higher |
|---|---|---|---|---|
| 1 | 1/6 | 16.67% | 16.67% | 100% |
| 2 | 1/6 | 16.67% | 33.33% | 83.33% |
| 3 | 1/6 | 16.67% | 50.00% | 66.67% |
| 4 | 1/6 | 16.67% | 66.67% | 50.00% |
| 5 | 1/6 | 16.67% | 83.33% | 33.33% |
| 6 | 1/6 | 16.67% | 100% | 16.67% |
Read the last column when a game needs you to roll "4 or better" and you want to know if that's a coin flip. It is, exactly.
Two dice: the complete probability chart
Two dice are the foundation of craps, backgammon, Monopoly and most street dice games, so this is the chart worth memorising. Start with all 36 outcomes and the sum each one produces.
| 1 | 2 | 3 | 4 | 5 | 6 | |
|---|---|---|---|---|---|---|
| 1 | 2 | 3 | 4 | 5 | 6 | 7 |
| 2 | 3 | 4 | 5 | 6 | 7 | 8 |
| 3 | 4 | 5 | 6 | 7 | 8 | 9 |
| 4 | 5 | 6 | 7 | 8 | 9 | 10 |
| 5 | 6 | 7 | 8 | 9 | 10 | 11 |
| 6 | 7 | 8 | 9 | 10 | 11 | 12 |
Notice the diagonal of 7s running corner to corner. That's six cells, more than any other sum gets, and it explains why 7 dominates every two-dice game.
Counting each sum in that grid gives the core probability chart:
| Sum | Combinations | Fraction | Percent | 1 in | Odds against |
|---|---|---|---|---|---|
| 2 | 1 | 1/36 | 2.78% | 36.0 | 35 to 1 |
| 3 | 2 | 1/18 | 5.56% | 18.0 | 17 to 1 |
| 4 | 3 | 1/12 | 8.33% | 12.0 | 11 to 1 |
| 5 | 4 | 1/9 | 11.11% | 9.0 | 8 to 1 |
| 6 | 5 | 5/36 | 13.89% | 7.2 | 6.2 to 1 |
| 7 | 6 | 1/6 | 16.67% | 6.0 | 5 to 1 |
| 8 | 5 | 5/36 | 13.89% | 7.2 | 6.2 to 1 |
| 9 | 4 | 1/9 | 11.11% | 9.0 | 8 to 1 |
| 10 | 3 | 1/12 | 8.33% | 12.0 | 11 to 1 |
| 11 | 2 | 1/18 | 5.56% | 18.0 | 17 to 1 |
| 12 | 1 | 1/36 | 2.78% | 36.0 | 35 to 1 |
The distribution is symmetrical around 7. Sums 6 and 8 are equally likely, so are 5 and 9, and so on out to the twin 2.78% tails.
Games rarely ask for one exact sum, though. They ask for ranges, which means cumulative odds:
| Sum | This number or higher | This number or lower |
|---|---|---|
| 2 | 100% | 2.78% |
| 3 | 97.22% | 8.33% |
| 4 | 91.67% | 16.67% |
| 5 | 83.33% | 27.78% |
| 6 | 72.22% | 41.67% |
| 7 | 58.33% | 58.33% |
| 8 | 41.67% | 72.22% |
| 9 | 27.78% | 83.33% |
| 10 | 16.67% | 91.67% |
| 11 | 8.33% | 97.22% |
| 12 | 2.78% | 100% |
Row 7 is the pivot: 58.33% of rolls land on 7 or above, and the same share lands on 7 or below, because 7 itself belongs to both counts.
Why 7 is the most likely roll
Seven has more distinct routes to it than any other total: 1+6, 2+5, 3+4, 4+3, 5+2 and 6+1. Six routes out of 36.
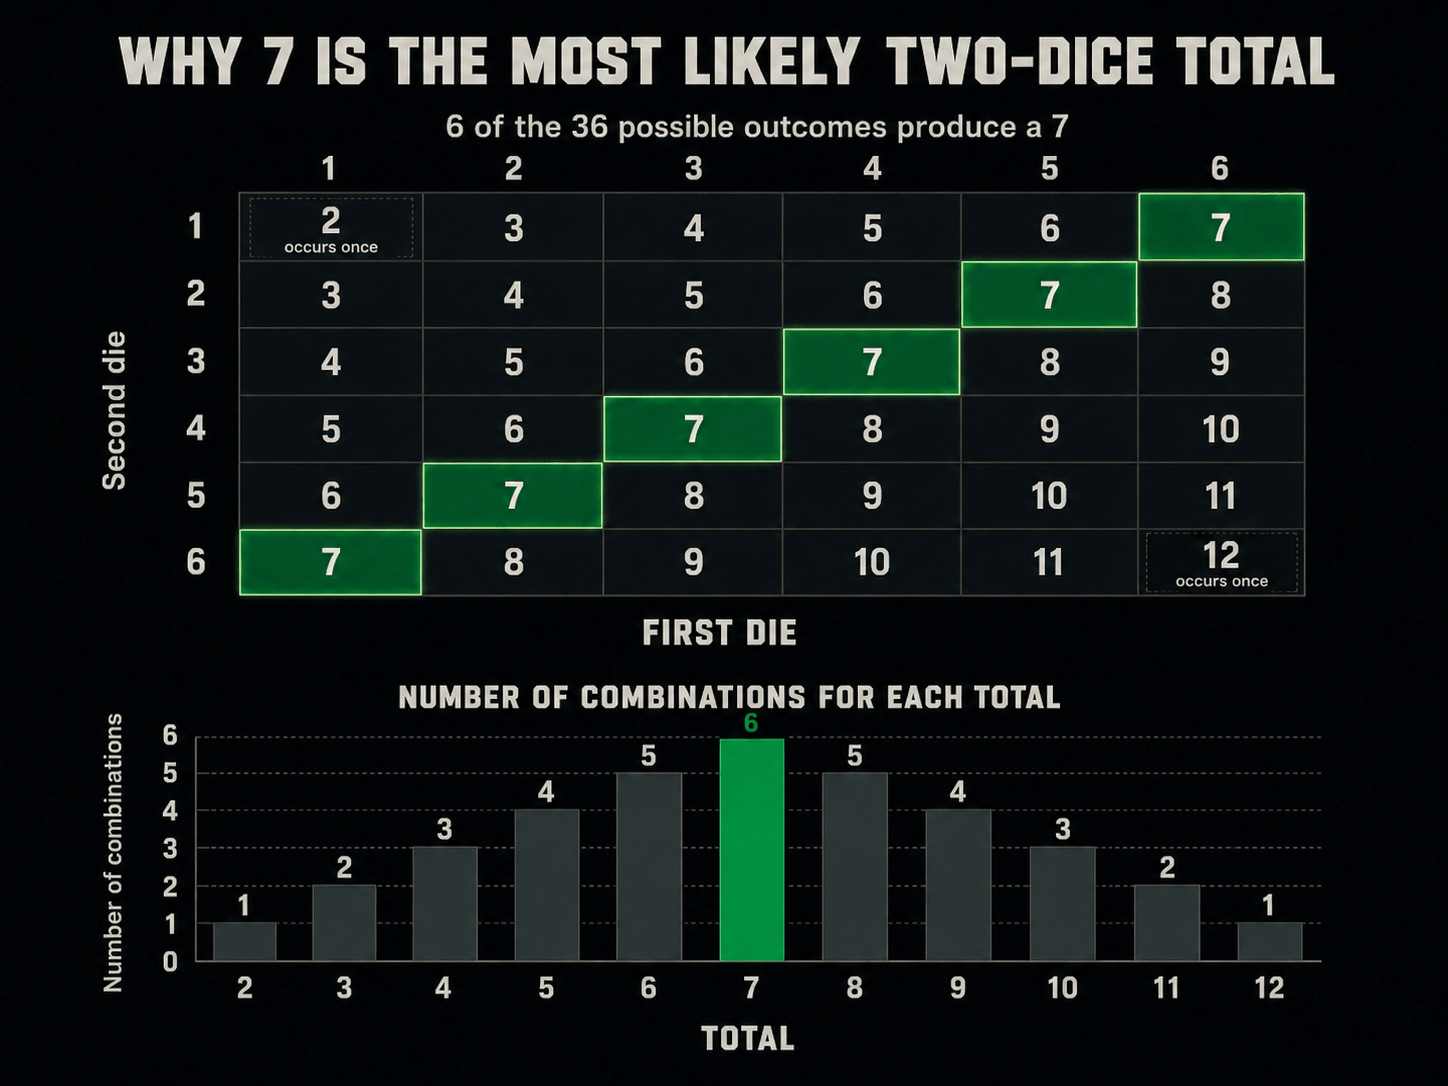
The structural reason is that 7 is the only sum reachable from every single face. Whatever the first die shows, exactly one value on the second die completes a 7. Compare that with 12, which needs a 6 and then only a 6. As sums move away from the centre, the number of first-die values that can still reach them shrinks, and the probability shrinks with it.
The odds of rolling doubles
Any double, meaning both dice matching, occupies the grid's main diagonal: 1-1, 2-2, 3-3, 4-4, 5-5, 6-6. Six outcomes out of 36, so 1/6 or 16.67%. Doubles are as common as rolling a 7.
A specific double is a different bet entirely. Double sixes is one outcome out of 36: 2.78%, or 35 to 1 against. People conflate the two and badly overrate their chances of a named pair.
Three, four, five and six dice
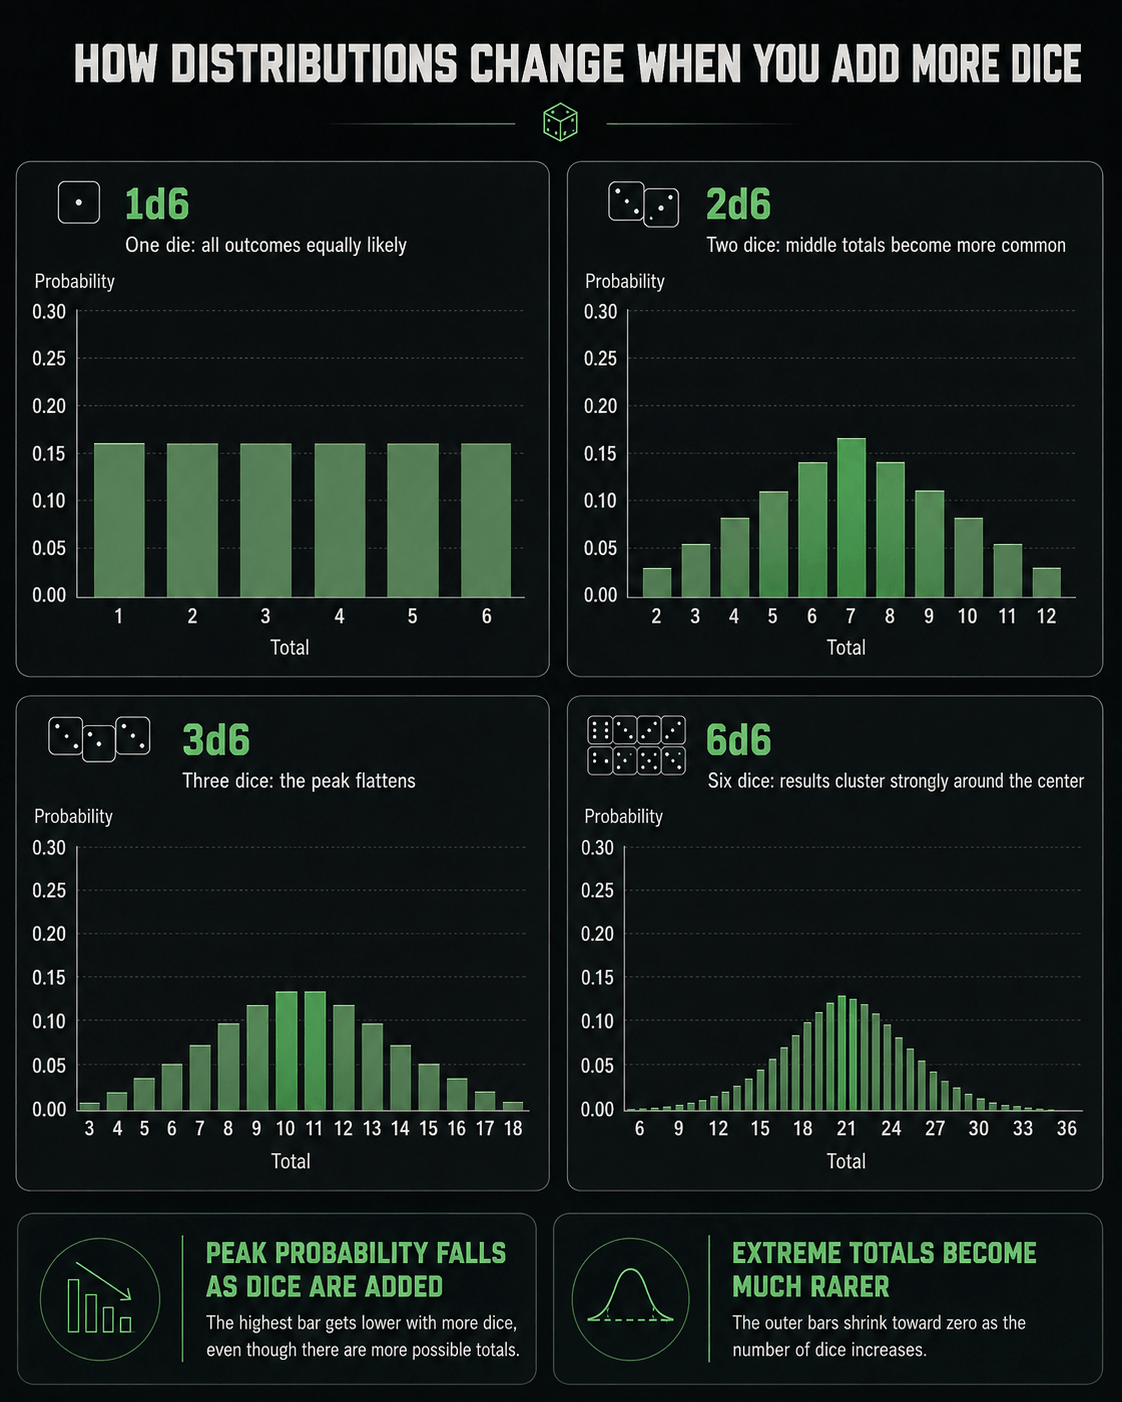
Add a third die and the outcome count jumps to 216. The sums now run 3 to 18, and the peak flattens: 10 and 11 tie at 12.50% each, well below the 16.67% that 7 held with two dice.
| Sum | Combinations | Fraction | Percent |
|---|---|---|---|
| 3 | 1 | 1/216 | 0.46% |
| 4 | 3 | 1/72 | 1.39% |
| 5 | 6 | 1/36 | 2.78% |
| 6 | 10 | 5/108 | 4.63% |
| 7 | 15 | 5/72 | 6.94% |
| 8 | 21 | 7/72 | 9.72% |
| 9 | 25 | 25/216 | 11.57% |
| 10 | 27 | 1/8 | 12.50% |
| 11 | 27 | 1/8 | 12.50% |
| 12 | 25 | 25/216 | 11.57% |
| 13 | 21 | 7/72 | 9.72% |
| 14 | 15 | 5/72 | 6.94% |
| 15 | 10 | 5/108 | 4.63% |
| 16 | 6 | 1/36 | 2.78% |
| 17 | 3 | 1/72 | 1.39% |
| 18 | 1 | 1/216 | 0.46% |
Rolling 18 with three dice takes one exact outcome in 216, which is why triple sixes pays what it pays in sic bo. More on that below.
Push further and a pattern sets in. Every extra die multiplies the outcomes by six, spreads the sums over a wider range, and lowers the peak:
| Dice | Outcomes | Sum range | Most likely sum | Its probability | Each extreme |
|---|---|---|---|---|---|
| 1 | 6 | 1 to 6 | all tied | 16.667% | 16.667% |
| 2 | 36 | 2 to 12 | 7 | 16.667% | 2.778% |
| 3 | 216 | 3 to 18 | 10 and 11 | 12.500% | 0.463% |
| 4 | 1,296 | 4 to 24 | 14 | 11.265% | 0.077% |
| 5 | 7,776 | 5 to 30 | 17 and 18 | 10.031% | 0.013% |
| 6 | 46,656 | 6 to 36 | 21 | 9.285% | 0.002% |
Two things happen at once, and they pull in opposite directions. No single sum stays as likely as before, since the peak falls from 16.67% to 9.29%. Yet the results cluster more tightly around the middle in relative terms: extreme sums become vanishingly rare, dropping from 2.78% with two dice to 0.002% with six. The distribution turns into a bell curve, which is the practical meaning of averaging. Roll enough dice and the total behaves predictably even though each die doesn't.
Odds for d4, d8, d10, d12 and d20
Non-cubic dice follow the same rule with a different denominator. Each face of a fair die with s sides has probability 1/s, and the chance of rolling a target value or better is (s − target + 1)/s.
The threshold table covers the question these dice are usually rolled to answer:
| Target or higher | d4 | d6 | d8 | d10 | d12 | d20 |
|---|---|---|---|---|---|---|
| 1+ | 100% | 100% | 100% | 100% | 100% | 100% |
| 2+ | 75.0% | 83.3% | 87.5% | 90.0% | 91.7% | 95.0% |
| 3+ | 50.0% | 66.7% | 75.0% | 80.0% | 83.3% | 90.0% |
| 4+ | 25.0% | 50.0% | 62.5% | 70.0% | 75.0% | 85.0% |
| 5+ | 33.3% | 50.0% | 60.0% | 66.7% | 80.0% | |
| 6+ | 16.7% | 37.5% | 50.0% | 58.3% | 75.0% | |
| 8+ | 12.5% | 30.0% | 41.7% | 65.0% | ||
| 10+ | 10.0% | 25.0% | 55.0% | |||
| 12+ | 8.3% | 45.0% | ||||
| 15+ | 30.0% | |||||
| 18+ | 15.0% | |||||
| 20+ | 5.0% |
A d20 needing 11 or higher is an even-money roll, the same as a d6 needing 4 or higher. Bigger dice don't change the logic, only the granularity. Our guide to types of dice covers the physical formats in more detail.
Cumulative odds: at least, at most, at least one
"At least one" questions trip up more people than any other kind, because the instinct is to add the chances together. Addition gives the wrong answer every time, and with enough rolls it gives an impossible one.
Count the failures instead. One roll misses a six with probability 5/6. Four independent rolls all miss with probability (5/6)⁴ = 48.23%, so at least one six shows up 51.77% of the time.
P(at least one) = 1 − (chance of missing)^number of rolls
| Rolls of one d6 | At least one six |
|---|---|
| 1 | 16.67% |
| 2 | 30.56% |
| 3 | 42.13% |
| 4 | 51.77% |
| 6 | 66.51% |
| 10 | 83.85% |
| 12 | 88.78% |
| 24 | 98.74% |
Six rolls give 66.51%, not the 100% that adding 16.67% six times would suggest. And no number of rolls ever reaches certainty, since (5/6)ⁿ shrinks toward zero without arriving.
The 1654 problem that started probability theory
Antoine Gombaud, who wrote under the name Chevalier de Méré, had been winning steadily on a bet that a six would appear in four rolls of one die. The table above says he was right to take it: 51.77% is a winning proposition, thin but real.
He then reasoned that betting on a double six within 24 rolls of two dice should work identically. His logic looked sound. A double six is one sixth as likely as a six, and 24 is six times four, so the bets should balance.
They don't. The correct figure is 1 − (35/36)²⁴ = 49.14%, which is a losing bet. De Méré lost money and asked Blaise Pascal why. The correspondence between Pascal and Pierre de Fermat that followed in 1654 worked out the mathematics of chance and is generally treated as the founding document of probability theory.
The gap that started a branch of mathematics was 2.63 percentage points. Keep that in mind when a dice bet looks close to fair.
From probability to payouts: true odds against what the table pays
Probability alone tells you nothing about whether a bet is good. What matters is the relationship between the odds against you and the money you collect when you win.
True odds are the fair payout, the one that would make a bet break even over time. The 2.78% chance of rolling a 12 corresponds to 35 to 1 against, so a fair game pays 35 units for every 1 risked. Casinos pay less than that, and the shortfall is the house edge.
Craps shows the whole range in one game. These are the standard figures, and the payouts are typical rather than universal, since houses vary:
| Bet | Win probability | True odds | Typical payout | House edge |
|---|---|---|---|---|
| Pass line | 49.29% | 251 to 244 | 1 to 1 | 1.41% |
| Free odds on 6 or 8 | 45.45% | 6 to 5 | 6 to 5 | 0.00% |
| Place 6 or 8 | 45.45% | 6 to 5 | 7 to 6 | 1.52% |
| Place 5 or 9 | 40.00% | 3 to 2 | 7 to 5 | 4.00% |
| Place 4 or 10 | 33.33% | 2 to 1 | 9 to 5 | 6.67% |
| 3 or 11 (one roll) | 5.56% | 17 to 1 | 15 to 1 | 11.11% |
| 2 or 12 (one roll) | 2.78% | 35 to 1 | 30 to 1 | 13.89% |
| Any 7 (one roll) | 16.67% | 5 to 1 | 4 to 1 | 16.67% |
The pass line resolves to 244/495, or 49.29%, which is close enough to even that the house keeps only 1.41%. The free odds bet is the rare exception on any casino floor: it pays exact true odds, so its edge is 0.00%, and it exists only as a supplement to a pass or don't pass bet that already carries an edge.
Compare the last three rows against the first three. Any 7 wins six times more often than 2 or 12, and it's still the worst bet listed, because paying 4 to 1 on a 5 to 1 shot strips out 16.67% of every stake. The same probability can be a fair bet or a terrible one depending entirely on the payout attached to it. Our breakdown of house edge and expected value works through the arithmetic in full.
Sic bo: what the three-dice chart costs you
Sic bo runs on the 216-outcome distribution charted earlier, which makes it a clean test of whether you can read a probability table. Every bet on the layout is priced off that chart, and the prices are inconsistent.
| Bet | Probability | True odds | Typical payout | House edge |
|---|---|---|---|---|
| Small (4 to 10) or Big (11 to 17) | 48.61% | 37 to 35 | 1 to 1 | 2.78% |
| Total 10 or 11 | 12.50% | 7 to 1 | 6 to 1 | 12.50% |
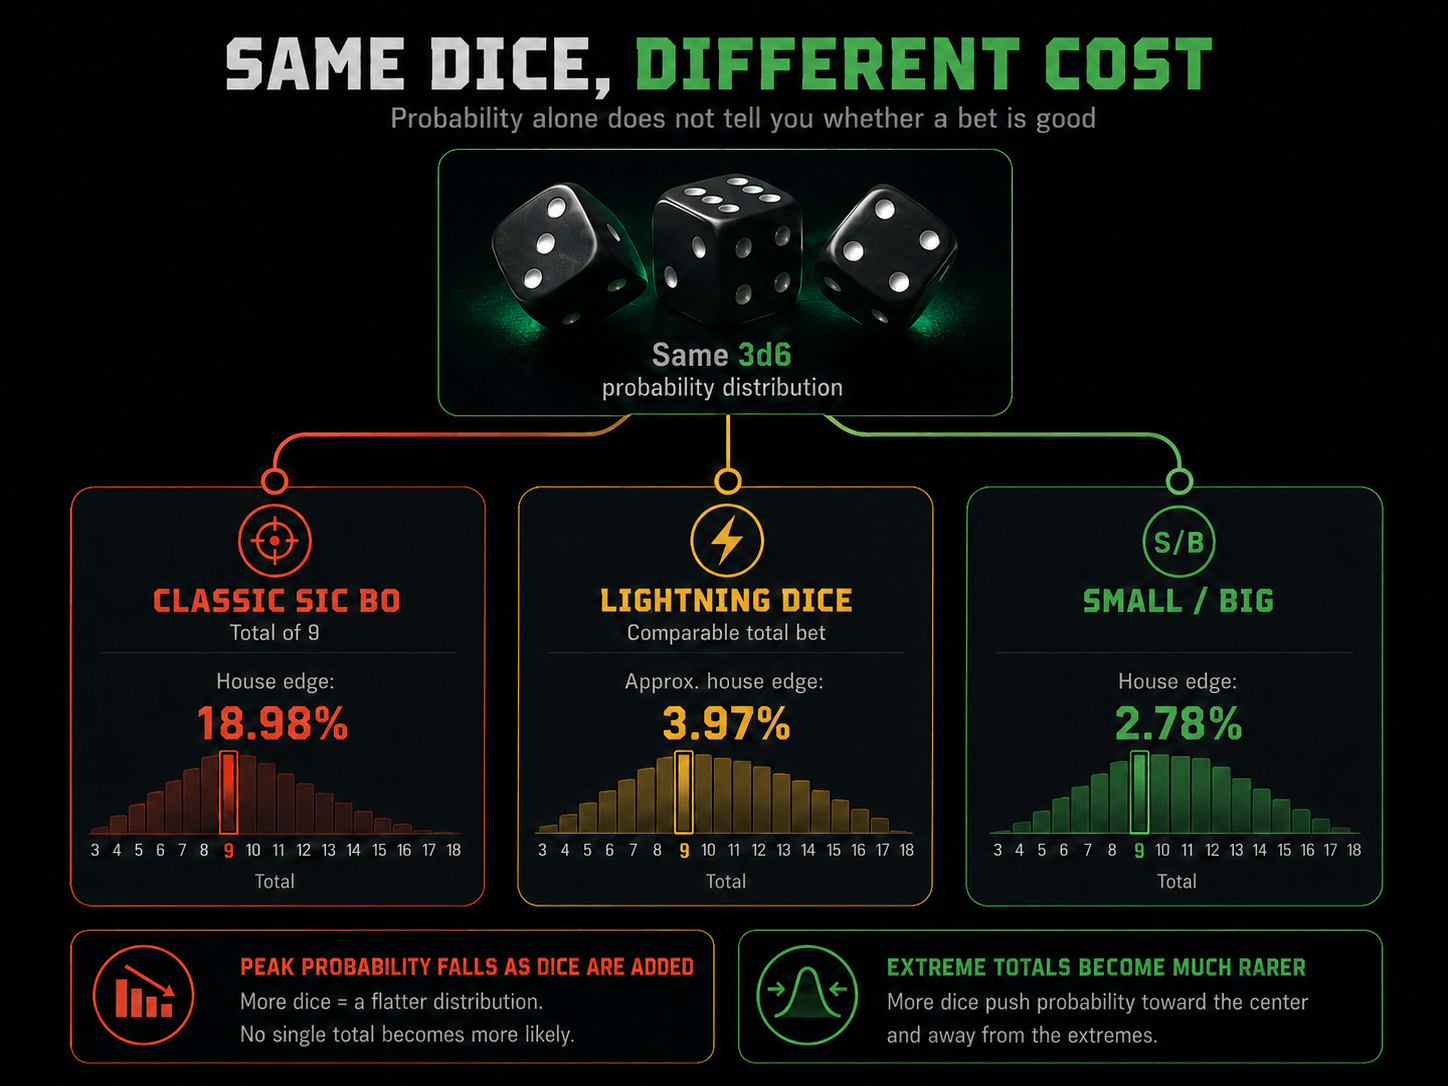
| Total 9 or 12 | 11.57% | 7.64 to 1 | 6 to 1 | 18.98% |
| Total 8 or 13 | 9.72% | 9.29 to 1 | 8 to 1 | 12.50% |
| Total 7 or 14 | 6.94% | 13.4 to 1 | 12 to 1 | 9.72% |
| Any triple | 2.78% | 35 to 1 | 30 to 1 | 13.89% |
| Specific triple | 0.46% | 215 to 1 | 180 to 1 | 16.20% |
| Single number (appears at least once) | 42.13% | not comparable | 1 to 1, 2 to 1, 3 to 1 | 7.87% |
Small and Big look like coin flips and nearly are. They cover seven totals each and win 105 times in 216, or 48.61%. The missing 2.78% is the triples, which lose to both, and that alone is the entire house edge on the bet.
The totals column is where the pricing falls apart. Nine and 12 pay 6 to 1 against true odds of 7.64 to 1, an 18.98% edge, while 10 and 11 pay the same 6 to 1 against 7 to 1 and cost 12.50%. Two bets, adjacent on the felt, identical payout, and one takes half again as much from you. Nothing on the table tells you which is which.
Single-number bets pay by frequency: 1 to 1 if your face shows once, 2 to 1 for twice, 3 to 1 for a triple. The presentation suggests a bonus structure, but your number fails to appear at all 57.87% of the time, and the full bet carries a 7.87% edge. Note that the single-number payout runs on face count rather than a single event, so a straight true-odds comparison doesn't apply to that row.
The pattern holds across dice games generally: the bets with the biggest advertised multipliers carry the worst edges. A 180 to 1 payout on a specific triple sounds generous until you find that the fair price is 215 to 1. See our ranking of casino games by house edge for how dice compare with everything else on the floor.
Online dice games: which of these charts still apply
"Dice" covers several unrelated products in an online casino, and the tables above price only some of them. Sort out which is which before carrying any of these numbers to a real game.
| Game | What actually gets rolled | Do these charts apply? | Published cost to play |
|---|---|---|---|
| Stake Dice, Primedice, BC.Game Classic Dice | One number from 0.00 to 100.00, every value equally likely | No | 1% house edge, 99% return, on Stake Dice |
| BC.Game Hash Dice, Ultimate Dice | The same over/under model | No | Quoted between 96% and 99% return depending on source |
| Sic Bo, Super Sic Bo, First Person Super Sic Bo | Three six-sided dice, 216 outcomes | Yes, exactly | 97.22% on Small or Big, lower on totals and triples |
| Lightning Dice | Three six-sided dice, 216 outcomes | Odds yes, pricing no | 96.03% return, 96.21% on 3 or 18 |
| Craps, First Person Craps | Two six-sided dice, 36 outcomes | Yes, exactly | Pass line 1.41% house edge |
The most-played dice game online is not a dice game. Stake Dice, Primedice and BC.Game's Classic Dice produce a single number between 0.00 and 100.00, and you bet on whether it lands above or below a threshold you set yourself. Every value is equally likely, so there's no peak, no bell curve and no most-common result. Nothing in the 36-cell grid or the 216-outcome table describes what happens.
That model also inverts who sets the odds. At a craps table the game fixes the probability of every bet and you choose from the menu. In online dice you choose the win chance and the multiplier follows from it, as (100 − house edge) ÷ win chance. At a 1% edge a 49.5% win chance pays 2.0000x, and a 10% win chance pays 9.9000x. Your expected cost is 1% either way. Compare that with the sic bo table above, where the same three dice charge anywhere from 2.78% to 18.98% depending on which box you back.
Sic bo is where this page earns its keep. Evolution's Super Sic Bo runs on the same 216 outcomes charted above, and its published returns are the exact complement of the house edges calculated here:
| Bet | House edge from the chart above | Super Sic Bo published return |
|---|---|---|
| Small or Big | 2.78% | 97.22% |
| Total 7 or 14 | 9.72% | 90.28% at base |
| Any triple | 13.89% | 86.11% at base |
Read the sic bo chart and you already know what that game charges.
Lightning Dice is the more interesting case. Three real dice drop through a tower, so the odds are identical to sic bo, but Evolution prices the game deliberately flat. Base payouts run from 149 to 1 on a total of 3 or 18 down to 4 to 1 on 10 or 11, and two to four totals collect boosted multipliers in every round. The result is a 96.03% return on essentially any bet, rising to 96.21% on 3 and 18. Classic sic bo pricing punishes you for backing the wrong total; Lightning Dice charges roughly the same wherever the money goes.
Put those two together and one distribution is being sold at three prices in the same lobby. A total of 9 costs 18.98% at classic sic bo payouts, about 3.97% in Lightning Dice, and Small or Big costs 2.78%. The dice never change. Only the paytable does.
Craps needs no translation at all. The live and First Person versions use two dice on the standard layout, so the pass line still runs at 1.41% and the free odds bet still pays true odds.
Two practical notes before you trust any published figure. Return percentages move between game versions and between sources: BC.Game's own channel has quoted Hash Dice at 96% return with a 4% edge while third-party lists give 99%, so read the info panel inside the game rather than a summary elsewhere. Fairness also works differently when you can't inspect a die you never touch. Crypto dice games commit to a result before your bet using HMAC-SHA256 over a server seed, your client seed and a nonce, then reveal the server seed when the seed pair is rotated so you can recompute every roll you made. Our guide to provably fair systems covers that verification step by step, and Stake Dice explained takes apart the mechanics and return of the single most copied version.
The one number these games really do change is turnover. A live craps table gives you a few decisions per minute, while an online dice game on auto-bet runs thousands of rolls in the same hour. Expected loss is the edge multiplied by everything you stake, so a 1% game played fast takes more from you than a 6.67% place bet played slowly. That arithmetic, rather than the edge on any single bet, is what empties most online bankrolls.
Why no betting system changes these numbers
Every table above describes a single roll, and a single roll doesn't care what you staked or what happened before it. The probability of a 7 is 16.67% on the first roll of the night and 16.67% on the thousandth, whether you're betting one unit or a hundred.
That fixed probability sets the expected loss per unit staked, and no staking pattern touches it. Doubling after a loss, as the Martingale prescribes, changes how much rides on each roll but not the price of the roll. The house edge applies to total money wagered, so a system that increases your stakes increases your expected loss in absolute terms.
What progressions do change is the shape of your results. A Martingale converts many small wins into rare, very large losses, which is why it feels effective for a while. The centre of the distribution stays where the edge put it. Only the spread moves, and a wider spread makes ruin arrive faster on the losing tail, which is the subject of risk of ruin.
Reading these charts well makes you a better-informed player, not a winning one. Their value is knowing which bets cost 0.00% and which cost 18.98%, and understanding why the difference exists. For the full argument, see why no betting system can beat the house edge.
Five mistakes people make with dice odds
Four sixes in a row does not make a fifth less likely. Dice have no memory and no mechanism for balancing anything out, so the chance stays 1/6 forever. This is the gambler's fallacy, and it survives because long runs of results really do converge on 16.67%, which players misread as a promise about the next roll.
The mirror image is just as common: deciding that a shooter on a good run has become more likely to keep rolling well. Physical dice have no skill state to be in. See the hot hand fallacy for how convincing that pattern looks from the rail.
Then there's the confusion between outcomes and sums. Outcomes are equally likely, sums are not, and the 36-cell grid above is the fastest way to see it. Anyone who accepts the same price on 4 and 10 that they'd take on 6 and 8 has made this mistake, and in sic bo it costs a measurable amount.
Adding probabilities rather than multiplying failure chances is the arithmetic version of the same carelessness. Six rolls at 16.67% give 66.51% for at least one six, not 100%. Keep adding and you'll eventually claim a figure above 100%, which is the clue that the method was wrong from the start.
Last, every number on this page assumes a fair die. Cheap dice have hollowed pips and rounded corners, and they land unevenly as a result. Nevada gaming regulations require casino dice to be true cubes to within 0.0005 inches, about 0.013 mm, with pips drilled out and refilled using material of matching density so no face finishes lighter than another. Standard casino dice measure 3/4 inch per side and weigh roughly 14 grams, which is why they feel nothing like the dice in a board game box. Our page on casino dice covers the specifications, and provably fair systems explain how online dice games let you verify a roll yourself.
Want to run your own numbers? Our dice probability calculator handles any combination of dice and targets, and the dice simulator rolls thousands of times so you can watch results converge on the figures in these charts.
FAQ
How do you calculate dice probability?
Divide the number of outcomes you want by the total number of outcomes. Two dice give 36 totals, and four of them add to 9, so P(9) = 4/36 = 11.11%. For several dice, the total outcomes are 6 raised to the number of dice.
Why is 7 the most likely dice roll?
Because it's the only sum every face can reach. Six of the 36 combinations add to 7, more than any other total, giving 16.67%.
What are the odds of rolling doubles?
Any double comes up 6 times in 36, so 16.67%. A specific pair such as double sixes is 1 in 36, or 2.78%.
What's the probability of rolling a six?
16.67% on one roll. Across several rolls it's 1 − (5/6)ⁿ: 30.56% in two rolls, 51.77% in four, 66.51% in six.
What's the probability of rolling 18 with three dice?
One outcome in 216, so 0.46%. Three sixes is the only way to get there, which is also why the sum of 3 has identical odds.
How many outcomes do three dice have?
Three dice produce 216 outcomes, from 6 × 6 × 6, spread across 16 possible sums from 3 to 18. Ten and 11 tie as the most common at 12.50% each.
What makes a die fair?
Equal probability on all faces, which requires uniform weight distribution and consistent dimensions. Casino dice are manufactured to tight tolerances for that reason. Online dice games can't be inspected physically, so they use cryptographic verification instead.